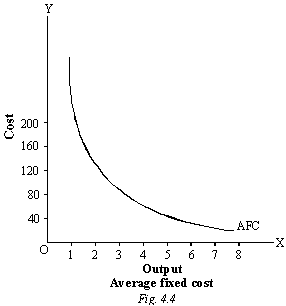
Average Fixed Cost (AFC). Average fixed cost can be obtained by dividing total fixed cost (TFC) but the quantity of output (Q),
AFC=TFC. Q
Features of AFC
(i) As output rises, the Average fixed cost (AFC) goes on decaling.
The AFC curve is therefore an onward sloping curve. (ii) As output approaches Zero, average fixed cost approaches infinity, but AFC curve never touches the Y-axis. On the other hand, as output reaches very high levels, average fixed cost approaches zero, but it never reduces itself to zero, it always remains positive. Hence the AFC curve never touches the X-axis also. Thus it follows that AFC curve never touches either of the axis. Actually this curve takes the shape of rectangular hyperbola, which shows that the area under the curve (i.e., total fixed cost) always remains the same. AFC is illustrated in the following table and diagram.
| Units of | TFC (Rs) | AFC (Rs) |
|
| 1 | 200 | – | |
| 2 | 200 | 200 | |
| 3 | 200 | 100 | |
| 4 | 200 | 667 | |
| 5 | 200 | 50 | |
| 6 | 200 | 333 |

- Average Variable Cost and Output:
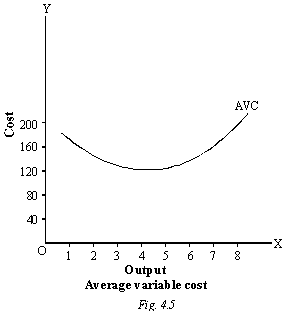
Average variable costs mean the total variable costs divided by the number of units produced. The Average variable costs will come down and then rise as more and more units are produced with a given plant. This is because as we add more units of variable factors in a fixed plant, the efficiency of the inputs first increases then it decreases.
The variable factors tend to produce a little more efficient near a firm’s optimum output than a very low levels of output. But once the optimum capacity is reached, any further in output will doubtlessly increase average variable cost quite sharply. Greater output may be obtained but at much greater average variable costs. As for example, if more and more workers are engaged, it may in the end, lead to overcrowding and bad organization.
Even more workers may be required to be paid higher wages for over-time work.
Average Variable (AVC)–Average variable cost can be obtained by dividing total fixed cost (TFC) by the quantity of output (Q),
AFC =
This is illustrated in the following example and diagram:
Example
| Unit of Production | TVC (Rs.) | AVC (Rs.) |
| 0 | 0 | – |
| 1 | 180 | 180 |
| 2 | 300 | 150 |
| 3 | 400 | 13.33 |
| 4 | 520 | 130 |
| 5 | 650 | 130 |
| 6 | 820 | 136.7 |
| 7 | 1060 | 151.4 |
| 8 | 1400 | 175.0 |

As output, the AVC curves first falls, reaches a minimum and then begins to rise. Thus, AVC curve has a U-shape. Its U-shape can be explained with the help of laws of retunes. Suppose for the optimum utilization of its plant a firm requires 60 laborers. If in the beginning there are only 30 laborers in a firm, out put will rise more than proportionate with the increase in the number of laborers. Because the increase in numbers would enable laborers to utilize the plant more efficiently through division of labor and specialization. Hence average variable cost will fall with the rise in the number of workers and output.
The points of optimum productive-Capacity for the firm will be at 60 laborers. If we would increase the number of laborers beyond this capacity (i.e., after 60 laborers), the average variable cost will rise. Thus in short, up to the point of optimum capacity of the plant operates the law of increasing returns which reduces the average variable cost with the rise in output, and after the point of optimum capacity operates the law of diminishing returns which increases the average variable cost. Thus, the average variable cost curve becomes U-shaped curve. In our example AVC fall up to 4 units of output thereafter it starts of rise.
- Average total cost and output. Average cost, consists of average fixed costs and average variable costs. As we see, average fixed costs begin to fall with an increase output while average variable costs come down and rise. Till the average variable cost come down, the average total cost also comes down, but a point comes when the average variable costs is more then the drop in average fixed cost then average total cost will show a rise. In this way, a stage will come when the average variable cost may have started rising, though the average total is less than the drop in average fixed cost.
Average Total Cost (ATC) or Average Cost (AC). Average total cost (ATC) is obtained by dividing the total cost (TC) by the quantity of output (Q). Or alternatively, it can also be obtained by adding Average fixed Cost (AFC) and Average Variable Cost (AVC)
ATC =
ATC = AFC + AVC
Diagrammatically the vertical summation of average fixed cost and average variable cost curves gives us the average total cost curve. The ATC curve is also an U-shaped curve.
