
Average Total Cost (ATC) or Average Cost (AC). Average total cost (ATC) is obtained by dividing the total cost (TC) by the quantity of output (Q). Or alternatively, it can also be obtained by adding Average fixed Cost (AFC) and Average Variable Cost (AVC)
ATC =
ATC = AFC + AVC
Diagrammatically the vertical summation of average fixed cost and average variable cost curves gives us the average total cost curve. The ATC curve is also an U-shaped curve.
- Marginal Cost (MC.) Marginal cost is the increase in total cost resulting from one unit increase in output. In short, it may be called incremental cost. Since a change in total is caused only by a change in total variable cost, marginal cost may also be defined as the increase in total variable cost resulting from on unit increase in output. Thus, marginal cost has nothing to do with the fixed costs.
MC =
or,
MC = TCn-TCn-1
TCn = Total cost of n units
TCn-1= Total cost of n-1 units.
Suppose the cost of 3 units of a commodity is Rs. 600 and now the total cost of 4 units becomes Rs.720 then the marginal cost will be Rs. 120(720-600).
It is worth nothing that like other per unit cost curves, marginal cost curve also has an U-shape. The follows directly from the behavior of TVC and TC curves in the diagram, to begin with, they rise at a diminishing rate. Their rate of increase being the marginal cost, MC curve falls. When the rate of increase of TC and TVC stops falling, begin to increase at an increasing rate, MC reaches its minimum point at lower level of output than do the AVC and ATC moreover, it intersects them both at respective minimum points.
The different short-run cost curves are illustrated in the following table and diagram.
| Units of Output
|
TFC
(RS.) |
TVC
(RS.) |
TC (TFC + TVC)
(RS.) |
AFC
(TVC/0)
(RS.) |
AVC
(TVC/0)
(RS.) |
ATC (AFC + AVC) or
(TC/0) (RS.) |
MC
(RS.) |
|
| 1 | 2 | 3 | 4 | 5 | 6 | 7 | 8 | |
| 0 | 200 | 0 | 200 | – | – | – | – | |
| 1 | 200 | 180 | 380 | 200 | 180 | 380 | 180 | |
| 2 | 200 | 300 | 500 | 100 | 150 | 250 | 120 | |
| 3 | 200 | 400 | 600 | 66.7 | 133.3 | 200 | 100 | |
| 4 | 200 | 520 | 720 | 50 | 130 | 180 | 120 | |
| 5 | 200 | 650 | 850 | 40 | 130 | 170 | 130 | |
| 6 | 200 | 820 | 1020 | 3.33 | 136.7 | 170 | 170 | |
| 7 | 200 | 1060 | 1260 | 2.86 | 151.4 | 180 | 240 | |
| 8 | 200 | 1400 | 1600 | 2.5 | 17.5 | 200 | 340 |
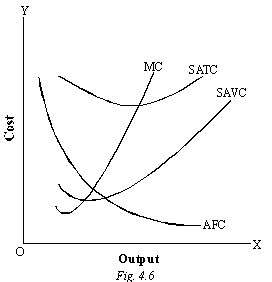
The cost-output relationship can also be shown better by joint short output cost curve a run through the use of graph. It will be seen that the average fixed cost curve (AFC Curve) falls as output rises from lower levels to higher levels. The shape of the average fixed cost curve, therefore, is a rectangular hyperbola. The average variable cost curve (AVC curve), First falls and then rises so also that average total cost curve (ATC curve). However, the AVC curve starts rising earlier than the ATC curve. Further, the least cost level of output corresponds to the point LT on ATC curve and not to the point LV, which lies on the AVC curve.
Another important point to be noted is that in Figure, the marginal cost curve (MC curve) intersects both the AVC curve and the ATC curve at their minimum points. This is very simple to explain. If marginal cost (MC) is less than the average cost (AC), it will pull AC down. If the MC is greater than AC, it will pull AC up. If the MC is equal to AC, it will neither pull Ac up nor down. Hence MC curve tends to intersect the AC curve at its lowest point. Similar is the position about the average variable cost curve. It will not make any difference whether MC is going up or down.
The inter-relationship between AVC, ATC and AFC can be summed up as follows:
- If both AFC and AVC fall, ATC will fall.
- If AFC falls but AVC rises;
- ATC will fall where the drop in AFC is more than the rise in AVC.
- ATC will not fall where the drop in AFC is equal to the rise in AVC.
- ATC will rise where the drop in AFC is less than the rise in AVC.
